
Is the world getting better? Most people answer that from headlines, which show what went wrong today, not what changed over a century. This post looks at seven measures of human progress, using only figures that link to a source. The short answer: extreme poverty and schooling have improved over the long run, the share of people who report suffering has fallen since 2014, healthy life expectancy fell during the pandemic, the share of people living in democracies has fallen since 2005, how much of your life is set at birth is mixed, and expert estimates of catastrophic risk are far above the natural background.
The seven measures of human progress, and how they were chosen
Each measure had to pass four tests:
- It measures what happens to people, not what causes it. That rules out things like GDP and technology, which matter only for what they do to people’s lives.
- It answers its own question about a human life, so the seven do not overlap and nothing big is left out.
- It shows up in the major frameworks for measuring human progress, such as the UN Human Development Index, the Social Progress Index, the OECD Better Life Index, and economist Amartya Sen’s work on what people are able to do and be.
- It has global data that is still moving. Literacy, for example, is close to its ceiling, so it no longer tells us much.
The seven, and the question each one answers:
- Life satisfaction: how do people feel about their own lives?
- Catastrophic risk: is there a future at all?
- Healthy life expectancy: how many years do people live in good health?
- Extreme poverty: are basic needs met?
- Years of schooling: can people develop their abilities?
- Democracy: do people get a say in how they are governed?
- Set at birth: does your own effort decide your life, or does the place and family you were born into?
How to read the charts
Each chart plots only figures quoted in the text beneath it, taken from the linked source. There are no forecasts, because forecasts for these measures over 100 years cannot be verified. Where a source gives only one or two data points, the chart shows only those. Poverty and schooling have no chart here because their long run series are published by the sources linked in each section, not reproduced.
1. Life satisfaction
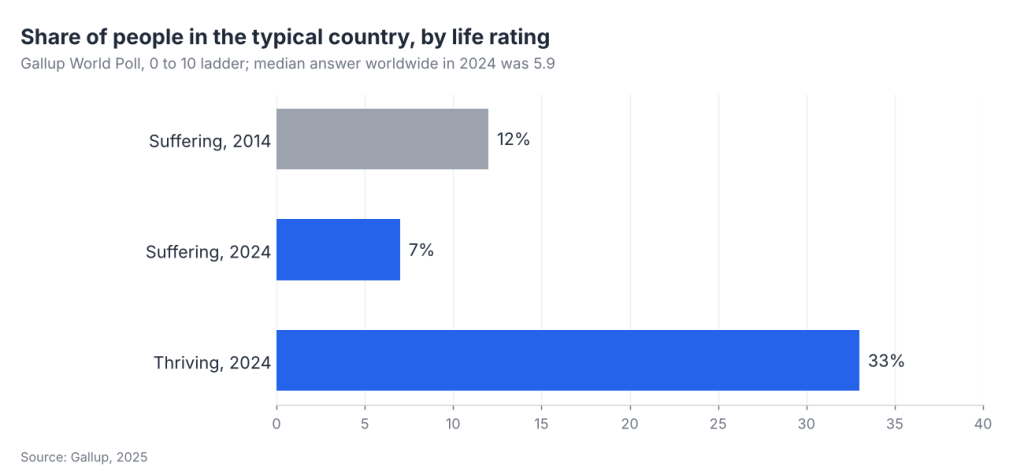
Gallup asks people in 142 countries and areas to picture a ladder where the bottom rung is the worst possible life for them and the top rung is the best, then say which rung they stand on today. The median answer worldwide in 2024 was 5.9 out of 10. In the typical country, 33% of people rated their lives well enough to count as “thriving,” and 7% were “suffering,” matching the lowest point on record since 2007 and down from 12% in 2014 (Gallup, 2025).
This is the only measure that asks people directly, which is why it comes first. Its weakness is history: no comparable global survey exists before the mid 2000s, so we cannot compare today with 1900.
2. The chance of a catastrophe that ends everything
This measures the chance, per century, that humanity goes extinct or civilization collapses for good. It belongs on the list because if it ever happens, every other measure drops to zero permanently.
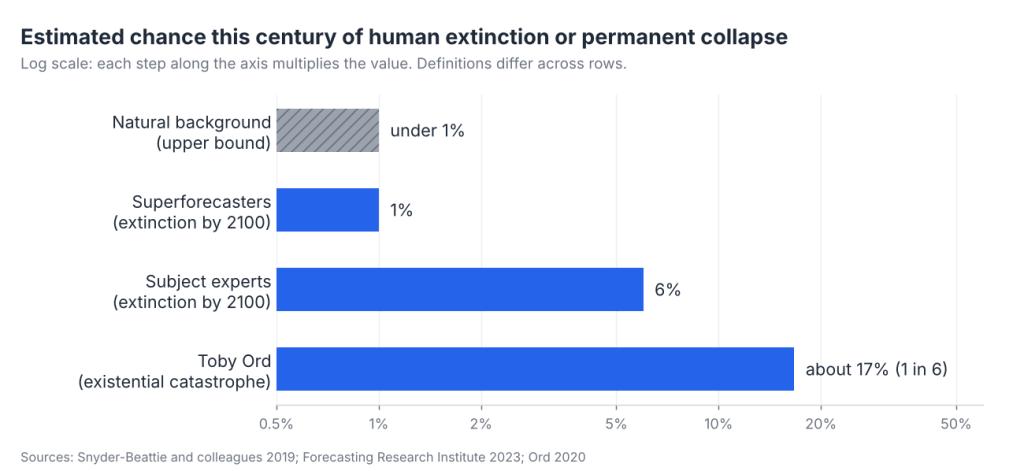
Before 1945, the only threats were natural ones, like asteroids and supervolcanoes. Because humans have survived for about 200,000 years, researchers can bound the natural extinction risk at well under 1% per century (Snyder-Beattie and colleagues, 2019; the paper gives annual bounds, and the per century figure is derived from them). Nuclear weapons changed that, and later pandemics and AI joined the list. Published estimates for this century now range from 1% (superforecasters, human extinction by 2100) to 6% (subject experts, same study, 2023) to about 17%, or 1 in 6 (philosopher Toby Ord, The Precipice, 2020). The definitions differ: the tournament figures are for extinction only, while Ord’s counts an existential catastrophe, which includes a permanent loss of humanity’s potential, so the lowest numbers are not directly comparable to the highest.
Note the scale on this chart: it is logarithmic, which is the only way to fit numbers this far apart. Also note what kind of number this is. Most other measures here count something that happened. This one is expert judgment about something that has never happened, which is why the estimates span such a wide range.
3. Healthy life expectancy
Plain life expectancy counts every year, including years spent seriously ill. Healthy life expectancy counts only the years lived in good health, so it captures both how long and how well a life runs.
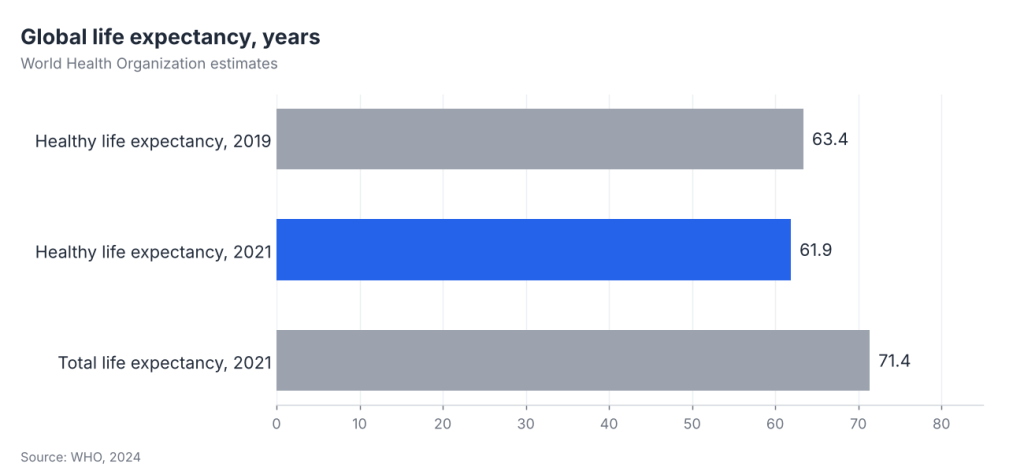
The World Health Organization puts global healthy life expectancy at 61.9 years in 2021, against a total life expectancy of 71.4. It had been 63.4 in 2019, so COVID took about 1.5 years off in two years, a reminder that the gains are not automatic (WHO, 2024). Looking ahead, the UN projects that total global life expectancy will reach 77.4 years by 2054 (UN World Population Prospects 2024).
4. Extreme poverty
The World Bank counts someone as extremely poor if they live on less than $3 a day, adjusted for local prices. Its current estimate is about 811 million people, roughly 1 in 10 (a nowcast, with the rate essentially unchanged since 2019) (World Bank).
The remaining poverty is the hardest to reach. The World Bank projects that 87% of the world’s extreme poor will live in Sub-Saharan Africa, in fragile and conflict-affected situations, or both by 2030, and that without stronger growth the number in extreme poverty will be higher in 2030 than today (World Bank).
5. Years of schooling
This is the average number of years of formal education among people aged 15 to 64 worldwide, from the Barro and Lee reconstruction published by Our World in Data, which charts the full series from 1870. Values after 2015 in that dataset are projections, so any present-day figure from it is a model estimate, not a count.
The bigger open question is one years of schooling cannot answer: whether people actually learn in those years. The World Bank’s modelled estimate for 2022 is that about 70% of ten year olds in low and middle income countries cannot read and understand a simple story (World Bank learning poverty report).
6. Democracy
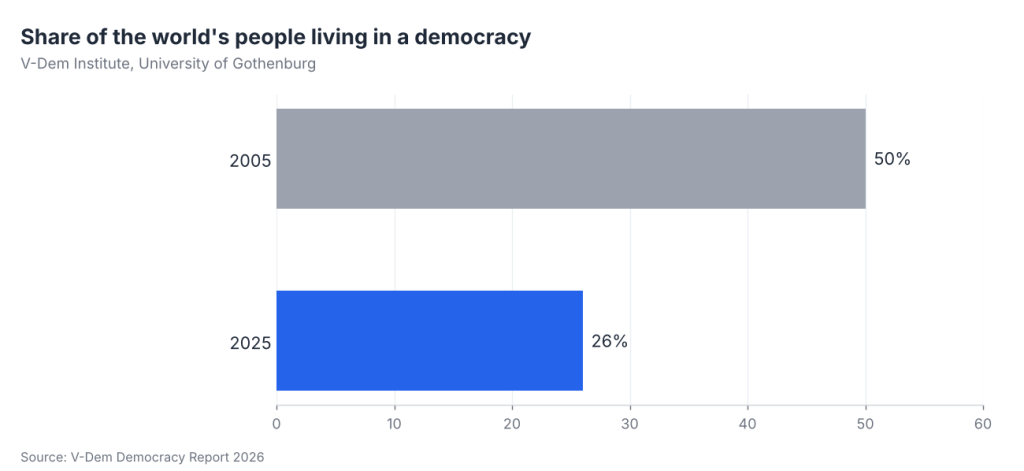
This is the share of the world’s people living in a democracy, as rated by the V-Dem Institute at the University of Gothenburg. V-Dem reports that it stood at 50% in 2005 and 26% in 2025.
By the end of 2025, 74% of people lived in autocracies and only 26% in democracies. For the average global citizen, V-Dem says democracy is back to its 1978 level. The United States lost its long-term status as a liberal democracy for the first time in over 50 years (V-Dem Democracy Report, 2026).
Of the seven measures, this is the one with the clearest recent decline.
7. How much of your life is set at birth
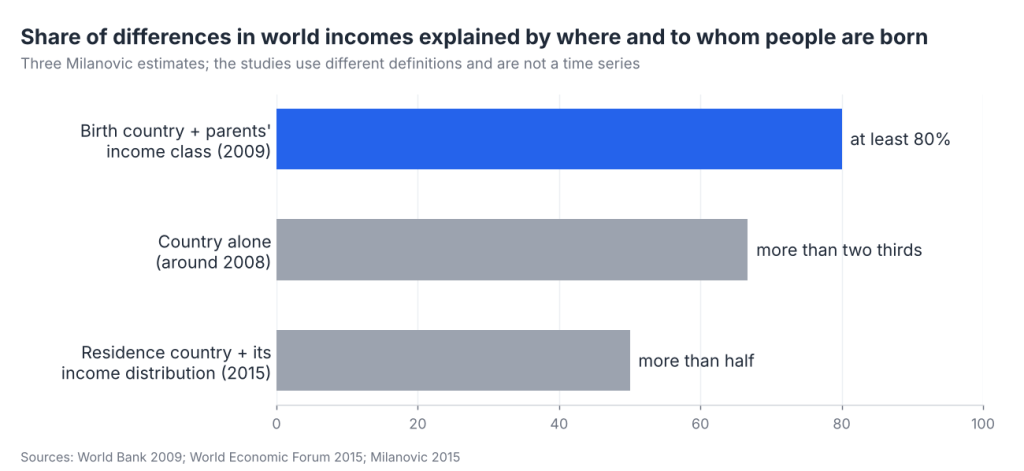
Of the seven measures, this one asks the most basic fairness question: how much of a person’s income is decided before they do anything at all, by the country they are born in and the family they are born into.
Economist Branko Milanovic found that country of birth plus parents’ income class accounts for at least 80% of the differences in income among almost 6 billion people, assuming no migration (World Bank, 2009). That leaves 20% or less for effort, choices, and luck.
The trend is mixed. In a later study Milanovic found that country of residence plus the income distribution within each country explains more than half of the variability in world incomes (Milanovic, 2015), and he has said country alone explained more than two thirds around 2008 (World Economic Forum). The studies use different definitions, so the three figures are not a time series. Parents also still matter in much of the world. Among people born in the 1980s, only 12% in the Central African Republic, Guinea and South Sudan got more education than their parents, against 89% in South Korea. In four of the six large developing countries the World Bank studied (Brazil, China, Egypt, India, Indonesia and Nigeria), progress in outdoing parents’ education slowed after people born in the 1960s, and it stalled in China and Nigeria (World Bank, 2018).
No global measure of this exists every year, so there is no long series to chart.
Measures left out, and why
- Child mortality: already counted inside healthy life expectancy.
- GDP and income: these measure the economy, not people’s lives. Poverty captures what income means for those at the bottom.
- Climate: a cause rather than an outcome. Its effects on people show up in health, poverty, and catastrophic risk.
- Modern slavery: part of freedom, but global estimates are recent and infrequent (for example, ILO and Walk Free estimates for 2016 and 2021), so there is no long series to chart.
The big picture
The sourced figures give a mixed answer. In the typical country, the share of people suffering fell from 12% in 2014 to 7% in 2024. Extreme poverty is about 1 in 10 people, with progress stalled since 2019. Healthy life expectancy fell from 63.4 to 61.9 years between 2019 and 2021, and the UN projects total life expectancy rising to 77.4 by 2054.
Democracy and how much of life is set at birth tell a harder story. The share of people in democracies fell from 50% to 26% between 2005 and 2025, and Milanovic’s estimates attribute at least half of world income differences to where people live and the family they come from. Over everything sits the one risk that did not exist before 1945: a catastrophe that ends the whole project, which expert estimates put between 1% and about 17% this century.
Sources
- Gallup, More People Globally Living Better Lives (2025)
- Snyder-Beattie, Ord, and Bonsall, natural extinction risk bound (2019); Toby Ord, The Precipice (2020); Ezra Karger on the Existential Risk Persuasion Tournament (80,000 Hours; secondary summary of Forecasting Research Institute, 2023)
- World Health Organization, COVID-19 eliminated a decade of progress in global life expectancy (2024); UN World Population Prospects 2024
- World Bank, Poverty, Prosperity and Planet; World Bank, Learning Poverty report (2022)
- Barro and Lee, mean years of schooling, via Our World in Data
- V-Dem Institute, Democracy Report (2026)
- Branko Milanovic, Global Inequality of Opportunity, World Bank (2009); Milanovic, Review of Economics and Statistics (2015); World Economic Forum (2015)
- World Bank, Fair Progress? Economic Mobility Across Generations Around the World (2018)
Discover more from Laurie Stach
Subscribe to get the latest posts sent to your email.

